Having run a comprehensive trial for six months in one ward, Peninsula Community Health is introducing the Twist-N-View care charts into all 17 wards in their 14 community hospitals.
Peninsula is a not-for-profit Community Interest Company and provides NHS adult community health services to local people in Cornwall and Isles of Scilly. Sue Greenwood MBE, Dementia Lead at Peninsula, explains the background, how they conducted the trial and what the outcomes were.
“We recognised that personalisation of care is crucial if we are to meet the individual needs of the people we are delivering care to, but to offer that quality of care we needed to find a way of ensuring that staff had the information they needed about each person, particularly important when a person is unable to communicate their own needs and preferences.
“We were using our admission paperwork but this did not prompt staff to ask the questions that would inform us of the individual person, knowing who they are, what mattered to them and how they wished to be cared for and supported. The driver for Peninsula Community Health was a move towards treating people as individuals and not as a clinical condition. Working with the staff in the clinical area was challenging, however support and guidance and education enabled us to ensure the ward team owned the change that was needed.
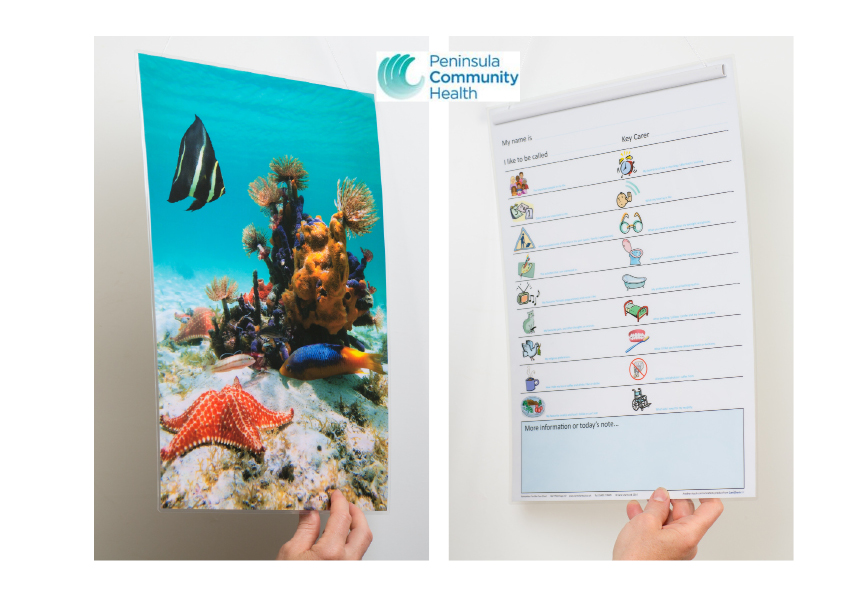
“Care Charts UK’s Twist-N-View charts allowed us to design bespoke care needs for individual patients. The charts are easily accessible and available for the whole multi-disciplinary team. We introduced one to one educational interactive sessions to start to talk to the staff about personalisation of care and how the charts could be used to ensure that those really important conversations with the patient and the carer or family member could lead to better understanding of individual needs and what’s really important for that person. One way of doing this was for staff to complete a chart about themselves.
“The team have been supported in the adoption of the charts by specialists as well as peer to peer support and training. No change is easy to implement, inevitable barriers do have to be addressed, however the ward team have wholly owned this change and have been able to overcome some of the initial resistance to the change in practice.
“The feedback received from some staff was really exciting; the charts gave staff opportunistic moments to interact with patients. This was a new experience for some staff (Health Care Assistants, General Service Assistants, Therapy Support Staff and House Keepers) who may have felt reluctant to engage in conversation prior to the introduction of the charts. We have also been able to work in partnership with the 3rd sector in utilising the skills of volunteers in completing the charts.
“We were able to achieve the foundations we needed to build on around the introduction of personalisation of care. The charts allowed us to go beyond just a list of likes. What’s important to people goes beyond the information that is collected using admission paperwork which tends to concentrate on the condition or medical problem rather than the person. We were also able to understand what we could do to manage difficult situations that may arise, for instance what to do if someone with dementia became agitated or confused. Periods like this can very easily escalate and become very difficult to manage. If we could understand the person and understand what family members and loved ones do at home to manage this then we could better care for the people we were looking after and understand much more of the person we were caring for.
“Staff on the unit became involved in completing the charts; it allowed our Health Care Assistants, Housekeepers, Therapy Support staff and General Service Assistants to be a part of the care delivered to patients. In short, it connected every member of the team to the patient and recognised their value and the care they delivered every day to patients. This had never been validated before and was very well received on the unit. For an organisation this was a very exciting tool that enabled us to shift the agenda towards the Personalisation of Care at a much quicker pace than was expected. It also allowed those staff involved in care every day to validate their worth and feel included in the delivery of high quality care. Because we were able to fully understand the individual needs of our patients the introduction of the charts enabled us to reduce the time a patient needed to stay in hospital. We were also able to reduce the number of complaints and inappropriate referrals.
The return on investment is evident in numerous areas:
- Raised the quality of care being provided
- Increased positive outcomes for patients and families
- Reduction in complaints
- Reduction in episodes of distress and agitation
- Being able to provide the right care at the right time
- Reduction in average length of stay
- Increased staff satisfaction / improved staff morale
- Increase in staff awareness of personalisation of care
- Better use of clinical time”
Steve Jenkin Chief Executive Peninsula Community Health
“The introduction of the Care Charts has enabled us to build a firm foundation within Peninsula Community Health in relation to the Personalisation of Care which is central to the way we want to deliver care and work in partnership with families and carers. Because the charts can be wiped off and re-used we are confident that the eventual cost will be a matter of pence per patient.”
Quantitative Data
Peninsula calculated that the financial saving as a result of reducing the average length of stay equated to more than 10 times the cost of the charts in a 6 month period. That’s over 1000% Return on Investment in 6 months.
Qualitative Data
Peninsula collected an extensive range of feedback from members of staff, patients and their family during the trial. Here are a few of those comments…
Relatives
“It’s nice to know that staff can talk to mum about things which interest her when we are not here as we are unable to visit every day”
“This helps people to know the person”
“Gives staff a greater understanding, the care is good”
“This covers some really important information about my dad”
“Don’t see any problems with confidentiality”
“The more information staff has the better they can provide care”
Staff
“Information recorded about how patients drink tea is very relevant to my swallowing assessments”
“As long as care staff are referring to the information I think it’s a great idea, I will now be able to add safe swallowing advice in the additional notes section”
“Over all a good idea in light of importance of confidentiality”
“Great when gaining rapport and trust for assessments”
“Very good as I always like to know what someone’s occupation was, as well as interests when they were younger”
“No problem with confidentiality as they look like pictures”
“This is a good tool especially if the information is detailed”
“It’s a great quick reference especially as I don’t always know the patients well”
“Very informative, it was also a good way to interact with patients, and a great way of having a good understanding of their overall likes and dislikes and limitations etc.”
Patients
“Good, simple and effective” “Very positive way of promoting communication between staff patients and family members”
“Good idea and it brightens up the ward”
“The information is very good”
“Staff seem to talk to me more about things that interest me”
“It’s perfect”
“I have been in before but everyone seems to know more about me this time”
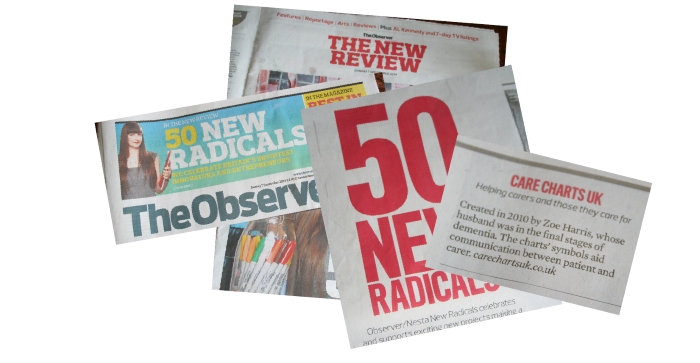
 Care Charts UK has been included on the 2014 New Radicals list, compiled by Nesta, the UK’s innovation foundation, and The Observer.
 John Mulholland, Editor of The Observer, said: “It’s a thrilling list – here are people or groups of people who are organising, collaborating and active in a way that helps transform lives and communities. It’s an antidote to apathy and cynicism – this is about activism. The ways in which these people act has the effect of materially changing the lives of Britons for the better. I think the message is clear – if at all possible, do something. It’s almost always better than doing nothing.”